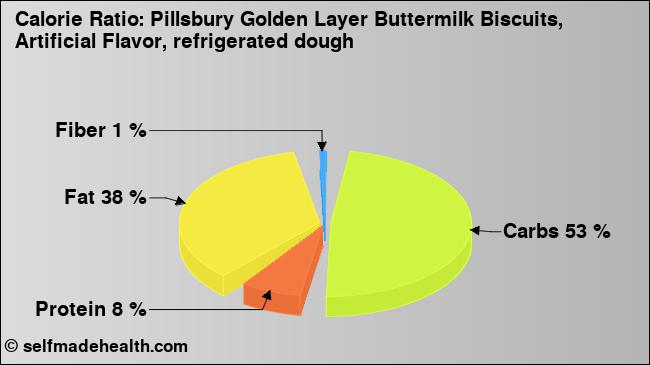
Nutrition values of Pillsbury Golden Layer Buttermilk Biscuits, Artificial Flavor, refrigerated dough
according to USDA Food Composition Database Standard Reference 04.2018
Not the right food? Find other foods
The following nutrition values are sourced from: USDA Food Composition Database Standard Reference 04.20181.
Nutrition values
Amount per 100g (edible portion)
Nutrition Facts
Detailed Values
Energy
Amount per 100g (edible portion)
Daily Value %*
Energytotal energy
307
kcalkilocalorie
Energytotal energy
1286
kjkilojoule
Carbohydrates
Amount per 100g (edible portion)
Daily Value %*
Carbohydrates
41.18
ggram
Sugarstotal
5.88
ggram
Dietary fibertotal dietary fiber
1.2
ggram
Fat
Amount per 100g (edible portion)
Daily Value %*
Fat
13.24
ggram
Fatty acids, total saturated
2.941
ggram
Fatty acids, total trans
4.412
ggram
An empty value in the table means that no value is available and nothing is being said about it. 0 / 0.0 / 0.000 means that the nutrient is not contained at all or only in slight amounts.
The table above contains values from the following nutrition databases.
Notices
* Calculating the percentages of daily intake are for a 45 year old person and the average of man and woman. For the calculation the recommended dietary allowance (RDA) is used and, if not available, estimates of adequate intake (AI) or estimates of average requirement (EAR) are used.
** Calculated with the following factors: carbohydrates 4 kcal/g, proteins 4 kcal/g, fat 9 kcal/g, fibers 2 kcal/g, alcohol 7 kcal/g.
Sources
1
US Department of Agriculture. Agricultural Research Service. (2018). USDA National Nutrient Database for Standard Reference, Legacy (2018). Retrieved from https://ndb.nal.usda.gov/ndb/ at 2018-12-18.