Nutrition values of Veal, shoulder, arm, separable lean and fat, cooked, braised
according to USDA Food Composition Database Standard Reference 04.2018
Not the right food? Find other foods
The following nutrition values are sourced from: USDA Food Composition Database Standard Reference 04.20181.
Nutrition values
Amount per 100g (edible portion)
Nutrition Facts
Nutrition Facts
Amount per 100g (edible portion)
Daily Value %*
Nutrition Facts
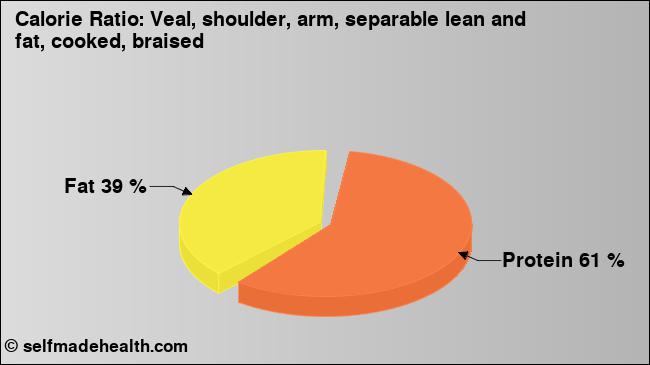
Fat
10.24
ggram
Fatty acids, total saturated
3.960
ggram
Fatty acids, total monounsaturated
3.990
ggram
Fatty acids, total polyunsaturated
0.700
ggram
Carbohydrates
0.00
ggram
Dietary fibertotal dietary fiber
0.0
ggram
Protein
33.63
ggram
Vitamin Ctotal ascorbic acid
CalciumCa
MagnesiumMg
SodiumNa
Detailed Values
Energy
Amount per 100g (edible portion)
Daily Value %*
Energytotal energy
236
kcalkilocalorie
Energytotal energy
987
kjkilojoule
Carbohydrates
Amount per 100g (edible portion)
Daily Value %*
Carbohydrates
0.00
ggram
Dietary fibertotal dietary fiber
0.0
ggram
Fat
Amount per 100g (edible portion)
Daily Value %*
Fat
10.24
ggram
Fatty acids, total saturated
3.960
ggram
10:0
0.010
ggram
12:0
0.030
ggram
14:0
0.380
ggram
16:0
2.130
ggram
18:0
1.310
ggram
Fatty acids, total monounsaturated
3.990
ggram
16:1 undifferentiated
0.430
ggram
18:1 undifferentiated
3.470
ggram
Fatty acids, total polyunsaturated
0.700
ggram
18:2 undifferentiated
0.550
ggram
18:3 undifferentiated
0.070
ggram
20:4 undifferentiated
0.080
ggram
Protein
Amount per 100g (edible portion)
Daily Value %*
Protein
33.63
ggram
Alanine
2.000
ggram
Arginine
1.978
ggram
Aspartic acid
2.901
ggram
Cystine
0.380
ggram
Glutamic acid
5.319
ggram
Glycine
1.728
ggram
Histidine
1.221
ggram
Isoleucine
1.656
ggram
Leucine
2.676
ggram
Lysine
2.771
ggram
Phenylalanine
1.357
ggram
Proline
1.404
ggram
Serine
1.260
ggram
Threonine
1.469
ggram
Tryptophan
0.340
ggram
Tyrosine
1.072
ggram
Valine
1.858
ggram
Methionine
0.785
ggram
Vitamins
Amount per 100g (edible portion)
Daily Value %*
Vitamins
Vitamin A
0
iuinternational units
Vitamin A
0
μgmicrogram
RetinolVitamin A1
0
μgmicrogram
Thiamin
RiboflavinVitamin B-2
NiacinVitamin B-3
10.080
mgmiligram
Pantothenic acidVitamin B-5
Vitamin B-6
FolateIncludes folate from food plus folic acid
18
μgmicrogram
FolateIncludes folate from food plus folic acid
Folate, food
18
μgmicrogram
Folic acid
0
μgmicrogram
Vitamin B-12Cobalamin
Vitamin Ctotal ascorbic acid
Vitamin E
Alpha-Tocopherol
An empty value in the table means that no value is available and nothing is being said about it. 0 / 0.0 / 0.000 means that the nutrient is not contained at all or only in slight amounts.
The table above contains values from the following nutrition databases.
Notices
* Calculating the percentages of daily intake are for a 45 year old person and the average of man and woman. For the calculation the recommended dietary allowance (RDA) is used and, if not available, estimates of adequate intake (AI) or estimates of average requirement (EAR) are used.
** Calculated with the following factors: carbohydrates 3.9 kcal/g, proteins 4.3 kcal/g, fat 9 kcal/g, fibers 2 kcal/g, alcohol 7 kcal/g.
Sources
1
US Department of Agriculture. Agricultural Research Service. (2018). USDA National Nutrient Database for Standard Reference, Legacy (2018). Retrieved from https://ndb.nal.usda.gov/ndb/ at 2018-12-18.