Nutrition values of Bagels, egg
according to USDA Food Composition Database Standard Reference 04.2018
Not the right food? Find other foods
The following nutrition values are sourced from: USDA Food Composition Database Standard Reference 04.20181.
Nutrition values
Amount per 100g (edible portion)
Nutrition Facts
Nutrition Facts
Amount per 100g (edible portion)
Daily Value %*
Nutrition Facts
Fat
2.10
ggram
Fatty acids, total saturated
0.421
ggram
Fatty acids, total monounsaturated
0.420
ggram
Fatty acids, total polyunsaturated
0.642
ggram
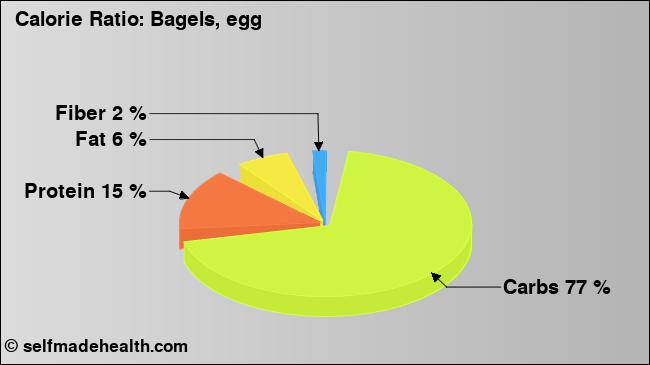
Carbohydrates
53.00
ggram
Dietary fibertotal dietary fiber
2.3
ggram
Protein
10.60
ggram
Vitamin Ctotal ascorbic acid
CalciumCa
MagnesiumMg
SodiumNa
Detailed Values
Energy
Amount per 100g (edible portion)
Daily Value %*
Energytotal energy
278
kcalkilocalorie
Energytotal energy
1163
kjkilojoule
Carbohydrates
Amount per 100g (edible portion)
Daily Value %*
Carbohydrates
53.00
ggram
Dietary fibertotal dietary fiber
2.3
ggram
Fat
Amount per 100g (edible portion)
Daily Value %*
Fat
2.10
ggram
Fatty acids, total saturated
0.421
ggram
8:0
0.000
ggram
10:0
0.000
ggram
12:0
0.000
ggram
14:0
0.003
ggram
16:0
0.341
ggram
18:0
0.076
ggram
Fatty acids, total monounsaturated
0.420
ggram
16:1 undifferentiated
0.035
ggram
18:1 undifferentiated
0.382
ggram
20:1
0.002
ggram
22:1 undifferentiated
0.000
ggram
Fatty acids, total polyunsaturated
0.642
ggram
18:2 undifferentiated
0.600
ggram
18:3 undifferentiated
0.026
ggram
20:4 undifferentiated
0.012
ggram
20:5 n-3 (EPA)
0.000
ggram
22:6 n-3 (DHA)
0.003
ggram
Protein
Amount per 100g (edible portion)
Daily Value %*
Protein
10.60
ggram
Alanine
0.353
ggram
Arginine
0.394
ggram
Aspartic acid
0.481
ggram
Cystine
0.231
ggram
Glutamic acid
3.548
ggram
Glycine
0.370
ggram
Histidine
0.231
ggram
Isoleucine
0.411
ggram
Leucine
0.748
ggram
Lysine
0.261
ggram
Phenylalanine
0.523
ggram
Proline
1.189
ggram
Serine
0.528
ggram
Threonine
0.306
ggram
Tryptophan
0.125
ggram
Tyrosine
0.308
ggram
Valine
0.461
ggram
Methionine
0.190
ggram
Vitamins
Amount per 100g (edible portion)
Daily Value %*
Vitamins
Vitamin A
109
iuinternational units
Vitamin A
33
μgmicrogram
RetinolVitamin A1
33
μgmicrogram
Thiamin
RiboflavinVitamin B-2
NiacinVitamin B-3
3.443
mgmiligram
Pantothenic acidVitamin B-5
Vitamin B-6
FolateIncludes folate from food plus folic acid
88
μgmicrogram
FolateIncludes folate from food plus folic acid
Folate, food
22
μgmicrogram
Folic acid
66
μgmicrogram
Vitamin B-12Cobalamin
Vitamin Ctotal ascorbic acid
An empty value in the table means that no value is available and nothing is being said about it. 0 / 0.0 / 0.000 means that the nutrient is not contained at all or only in slight amounts.
The table above contains values from the following nutrition databases.
Notices
* Calculating the percentages of daily intake are for a 45 year old person and the average of man and woman. For the calculation the recommended dietary allowance (RDA) is used and, if not available, estimates of adequate intake (AI) or estimates of average requirement (EAR) are used.
** Calculated with the following factors: carbohydrates 4.1 kcal/g, proteins 4 kcal/g, fat 8.6 kcal/g, fibers 2 kcal/g, alcohol 7 kcal/g.
Sources
1
US Department of Agriculture. Agricultural Research Service. (2018). USDA National Nutrient Database for Standard Reference, Legacy (2018). Retrieved from https://ndb.nal.usda.gov/ndb/ at 2018-12-18.