Nutrition values of Cookies, peanut butter sandwich, special dietary
according to USDA Food Composition Database Standard Reference 04.2018
Not the right food? Find other foods
The following nutrition values are sourced from: USDA Food Composition Database Standard Reference 04.20181.
Nutrition values
Amount per 100g (edible portion)
Nutrition Facts
Nutrition Facts
Amount per 100g (edible portion)
Daily Value %*
Nutrition Facts
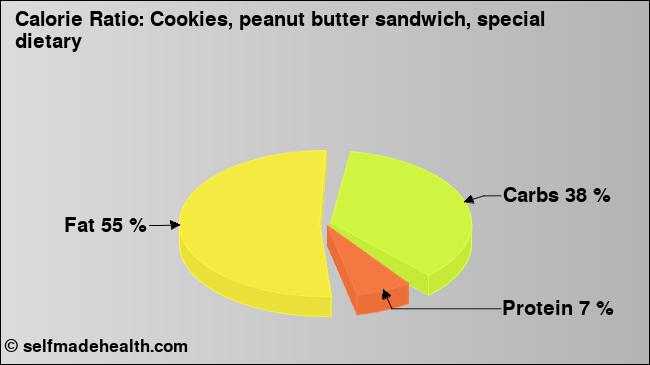
Fat
34.00
ggram
Fatty acids, total saturated
4.937
ggram
Fatty acids, total monounsaturated
15.391
ggram
Fatty acids, total polyunsaturated
12.026
ggram
Carbohydrates
50.80
ggram
Protein
10.00
ggram
Vitamin Ctotal ascorbic acid
CalciumCa
MagnesiumMg
SodiumNa
Detailed Values
Energy
Amount per 100g (edible portion)
Daily Value %*
Energytotal energy
535
kcalkilocalorie
Energytotal energy
2238
kjkilojoule
Fat
Amount per 100g (edible portion)
Daily Value %*
Fat
34.00
ggram
Fatty acids, total saturated
4.937
ggram
4:0
0.000
ggram
6:0
0.000
ggram
8:0
0.000
ggram
10:0
0.000
ggram
12:0
0.000
ggram
14:0
0.028
ggram
16:0
3.426
ggram
18:0
1.335
ggram
Fatty acids, total monounsaturated
15.391
ggram
16:1 undifferentiated
0.087
ggram
18:1 undifferentiated
15.110
ggram
20:1
0.172
ggram
22:1 undifferentiated
0.000
ggram
Fatty acids, total polyunsaturated
12.026
ggram
18:2 undifferentiated
11.454
ggram
18:3 undifferentiated
0.551
ggram
18:4
0.000
ggram
20:4 undifferentiated
0.000
ggram
20:5 n-3 (EPA)
0.000
ggram
22:5 n-3 (DPA)
0.000
ggram
22:6 n-3 (DHA)
0.000
ggram
Protein
Amount per 100g (edible portion)
Daily Value %*
Protein
10.00
ggram
Alanine
0.378
ggram
Arginine
0.998
ggram
Aspartic acid
1.034
ggram
Cystine
0.151
ggram
Glutamic acid
2.391
ggram
Glycine
0.538
ggram
Histidine
0.243
ggram
Isoleucine
0.363
ggram
Leucine
0.668
ggram
Lysine
0.367
ggram
Phenylalanine
0.509
ggram
Proline
0.607
ggram
Serine
0.505
ggram
Threonine
0.334
ggram
Tryptophan
0.111
ggram
Tyrosine
0.379
ggram
Valine
0.429
ggram
Methionine
0.109
ggram
Vitamins
Amount per 100g (edible portion)
Daily Value %*
Vitamins
Vitamin A
0
iuinternational units
Vitamin A
0
μgmicrogram
RetinolVitamin A1
0
μgmicrogram
Thiamin
RiboflavinVitamin B-2
NiacinVitamin B-3
5.259
mgmiligram
Pantothenic acidVitamin B-5
Vitamin B-6
FolateIncludes folate from food plus folic acid
54
μgmicrogram
FolateIncludes folate from food plus folic acid
Folate, food
33
μgmicrogram
Folic acid
21
μgmicrogram
Vitamin B-12Cobalamin
Vitamin Ctotal ascorbic acid
An empty value in the table means that no value is available and nothing is being said about it. 0 / 0.0 / 0.000 means that the nutrient is not contained at all or only in slight amounts.
The table above contains values from the following nutrition databases.
Notices
* Calculating the percentages of daily intake are for a 45 year old person and the average of man and woman. For the calculation the recommended dietary allowance (RDA) is used and, if not available, estimates of adequate intake (AI) or estimates of average requirement (EAR) are used.
** Calculated with the following factors: carbohydrates 4 kcal/g, proteins 3.6 kcal/g, fat 8.7 kcal/g, fibers 0 kcal/g, alcohol 7 kcal/g.
Sources
1
US Department of Agriculture. Agricultural Research Service. (2018). USDA National Nutrient Database for Standard Reference, Legacy (2018). Retrieved from https://ndb.nal.usda.gov/ndb/ at 2018-12-18.