Nutrition values of Crackers, rusk toast
according to USDA Food Composition Database Standard Reference 04.2018
Not the right food? Find other foods
The following nutrition values are sourced from: USDA Food Composition Database Standard Reference 04.20181.
Nutrition values
Amount per 100g (edible portion)
Nutrition Facts
Nutrition Facts
Amount per 100g (edible portion)
Daily Value %*
Nutrition Facts
Fat
7.20
ggram
Fatty acids, total saturated
1.376
ggram
Fatty acids, total monounsaturated
2.755
ggram
Fatty acids, total polyunsaturated
2.310
ggram
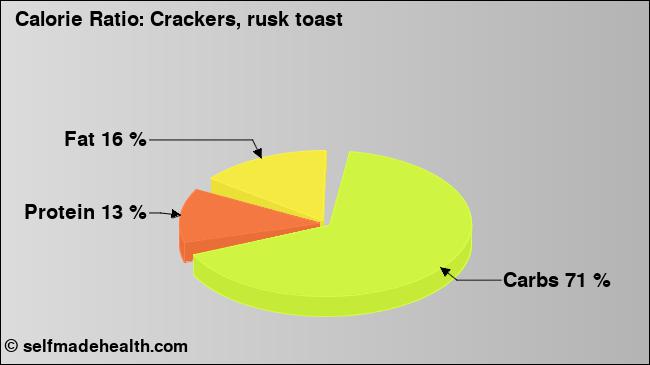
Carbohydrates
72.30
ggram
Protein
13.50
ggram
Vitamin Ctotal ascorbic acid
CalciumCa
MagnesiumMg
SodiumNa
Detailed Values
Energy
Amount per 100g (edible portion)
Daily Value %*
Energytotal energy
407
kcalkilocalorie
Energytotal energy
1703
kjkilojoule
Fat
Amount per 100g (edible portion)
Daily Value %*
Fat
7.20
ggram
Fatty acids, total saturated
1.376
ggram
4:0
0.000
ggram
6:0
0.000
ggram
8:0
0.000
ggram
10:0
0.000
ggram
12:0
0.000
ggram
14:0
0.011
ggram
16:0
0.973
ggram
18:0
0.386
ggram
Fatty acids, total monounsaturated
2.755
ggram
16:1 undifferentiated
0.065
ggram
18:1 undifferentiated
2.678
ggram
20:1
0.005
ggram
22:1 undifferentiated
0.000
ggram
Fatty acids, total polyunsaturated
2.310
ggram
18:2 undifferentiated
2.114
ggram
18:3 undifferentiated
0.143
ggram
18:4
0.003
ggram
20:4 undifferentiated
0.026
ggram
20:5 n-3 (EPA)
0.013
ggram
22:5 n-3 (DPA)
0.000
ggram
22:6 n-3 (DHA)
0.008
ggram
Protein
Amount per 100g (edible portion)
Daily Value %*
Protein
13.50
ggram
Alanine
0.606
ggram
Arginine
0.649
ggram
Aspartic acid
0.944
ggram
Cystine
0.272
ggram
Glutamic acid
3.192
ggram
Glycine
0.498
ggram
Histidine
0.309
ggram
Isoleucine
0.610
ggram
Leucine
1.010
ggram
Lysine
0.684
ggram
Phenylalanine
0.668
ggram
Proline
1.052
ggram
Serine
0.768
ggram
Threonine
0.512
ggram
Tryptophan
0.171
ggram
Tyrosine
0.471
ggram
Valine
0.684
ggram
Methionine
0.290
ggram
Vitamins
Amount per 100g (edible portion)
Daily Value %*
Vitamins
Vitamin A
41
iuinternational units
Vitamin A
12
μgmicrogram
RetinolVitamin A1
12
μgmicrogram
Thiamin
RiboflavinVitamin B-2
NiacinVitamin B-3
4.625
mgmiligram
Pantothenic acidVitamin B-5
Vitamin B-6
FolateIncludes folate from food plus folic acid
87
μgmicrogram
FolateIncludes folate from food plus folic acid
Folate, food
64
μgmicrogram
Folic acid
23
μgmicrogram
Vitamin B-12Cobalamin
Vitamin Ctotal ascorbic acid
An empty value in the table means that no value is available and nothing is being said about it. 0 / 0.0 / 0.000 means that the nutrient is not contained at all or only in slight amounts.
The table above contains values from the following nutrition databases.
Notices
* Calculating the percentages of daily intake are for a 45 year old person and the average of man and woman. For the calculation the recommended dietary allowance (RDA) is used and, if not available, estimates of adequate intake (AI) or estimates of average requirement (EAR) are used.
** Calculated with the following factors: carbohydrates 4 kcal/g, proteins 3.9 kcal/g, fat 8.9 kcal/g, fibers 0 kcal/g, alcohol 7 kcal/g.
Sources
1
US Department of Agriculture. Agricultural Research Service. (2018). USDA National Nutrient Database for Standard Reference, Legacy (2018). Retrieved from https://ndb.nal.usda.gov/ndb/ at 2018-12-18.