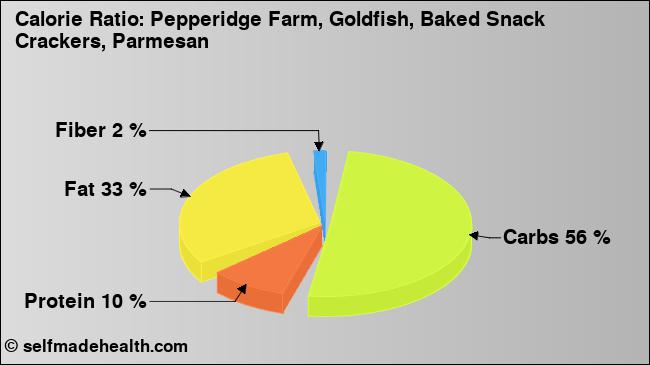
Nutrition values of Pepperidge Farm, Goldfish, Baked Snack Crackers, Parmesan
according to USDA Food Composition Database Standard Reference 04.2018
Not the right food? Find other foods
The following nutrition values are sourced from: USDA Food Composition Database Standard Reference 04.20181.
Nutrition values
Amount per 100g (edible portion)
Nutrition Facts
Nutrition Facts
Amount per 100g (edible portion)
Daily Value %*
Nutrition Facts
Fat
17.29
ggram
Fatty acids, total saturated
2.614
ggram
Fatty acids, total monounsaturated
9.223
ggram
Fatty acids, total polyunsaturated
3.431
ggram
Carbohydrates
64.70
ggram
Sugarstotal
0.83
ggram
Dietary fibertotal dietary fiber
3.5
ggram
Protein
11.16
ggram
CalciumCa
MagnesiumMg
SodiumNa
Detailed Values
Energy
Amount per 100g (edible portion)
Daily Value %*
Energytotal energy
459
kcalkilocalorie
Energytotal energy
1921
kjkilojoule
Carbohydrates
Amount per 100g (edible portion)
Daily Value %*
Carbohydrates
64.70
ggram
Sugarstotal
0.83
ggram
Sucrose
0.00
ggram
GlucoseD-Glucose, Dextrose
0.24
ggram
Fructose
0.00
ggram
Lactose
0.00
ggram
Maltose
0.59
ggram
Galactose
0.00
ggram
Dietary fibertotal dietary fiber
3.5
ggram
Fat
Amount per 100g (edible portion)
Daily Value %*
Fat
17.29
ggram
Fatty acids, total saturated
2.614
ggram
4:0
0.050
ggram
6:0
0.041
ggram
8:0
0.025
ggram
10:0
0.067
ggram
12:0
0.078
ggram
14:0
0.256
ggram
15:0
0.028
ggram
16:0
1.375
ggram
17:0
0.022
ggram
18:0
0.520
ggram
20:0
0.086
ggram
22:0
0.040
ggram
24:0
0.026
ggram
Fatty acids, total monounsaturated
9.223
ggram
14:1
0.026
ggram
15:1
0.000
ggram
16:1 undifferentiated
0.094
ggram
16:1 c
0.086
ggram
16:1 t
0.008
ggram
17:1
0.012
ggram
18:1 undifferentiated
8.909
ggram
18:1 c
8.856
ggram
20:1
0.158
ggram
22:1 undifferentiated
0.005
ggram
22:1 c
0.005
ggram
22:1 t
0.000
ggram
24:1 c
0.019
ggram
18:1 t
0.053
ggram
Fatty acids, total polyunsaturated
3.431
ggram
18:2 undifferentiated
3.034
ggram
18:2 CLAs
0.017
ggram
18:2 n-6 c,c
2.994
ggram
18:2 t not further defined
0.023
ggram
20:2 n-6 c,c
0.009
ggram
18:3 undifferentiated
0.376
ggram
18:3i
0.000
ggram
18:3 n-3 c,c,c (ALA)
0.362
ggram
18:3 n-6 c,c,c
0.014
ggram
20:3 undifferentiated
0.002
ggram
20:3 n-3
0.000
ggram
20:3 n-6
0.002
ggram
18:4
0.000
ggram
20:4 undifferentiated
0.004
ggram
22:4
0.000
ggram
20:5 n-3 (EPA)
0.000
ggram
22:5 n-3 (DPA)
0.003
ggram
22:6 n-3 (DHA)
0.000
ggram
Fatty acids, total trans
0.084
ggram
Fatty acids, total trans-monoenoic
0.061
ggram
Fatty acids, total trans-polyenoic
0.023
ggram
Vitamins
Amount per 100g (edible portion)
Daily Value %*
Vitamins
Thiamin
RiboflavinVitamin B-2
NiacinVitamin B-3
5.887
mgmiligram
Pantothenic acidVitamin B-5
Vitamin B-6
Minerals
Amount per 100g (edible portion)
Daily Value %*
MineralsCa
CalciumCa
MagnesiumMg
IronFe
SodiumNa
PhosphorusP
PotassiumK
ZincZn
CopperCu
ManganeseMn
An empty value in the table means that no value is available and nothing is being said about it. 0 / 0.0 / 0.000 means that the nutrient is not contained at all or only in slight amounts.
The table above contains values from the following nutrition databases.
Notices
* Calculating the percentages of daily intake are for a 45 year old person and the average of man and woman. For the calculation the recommended dietary allowance (RDA) is used and, if not available, estimates of adequate intake (AI) or estimates of average requirement (EAR) are used.
** Calculated with the following factors: carbohydrates 4 kcal/g, proteins 4 kcal/g, fat 9 kcal/g, fibers 2 kcal/g, alcohol 7 kcal/g.
Sources
1
US Department of Agriculture. Agricultural Research Service. (2018). USDA National Nutrient Database for Standard Reference, Legacy (2018). Retrieved from https://ndb.nal.usda.gov/ndb/ at 2018-12-18.