Nutrition values of Bread, stuffing, cornbread, dry mix
according to USDA Food Composition Database Standard Reference 04.2018
Not the right food? Find other foods
The following nutrition values are sourced from: USDA Food Composition Database Standard Reference 04.20181.
Nutrition values
Amount per 100g (edible portion)
Nutrition Facts
Nutrition Facts
Amount per 100g (edible portion)
Daily Value %*
Nutrition Facts
Fat
4.20
ggram
Fatty acids, total saturated
0.922
ggram
Fatty acids, total monounsaturated
1.662
ggram
Fatty acids, total polyunsaturated
1.073
ggram
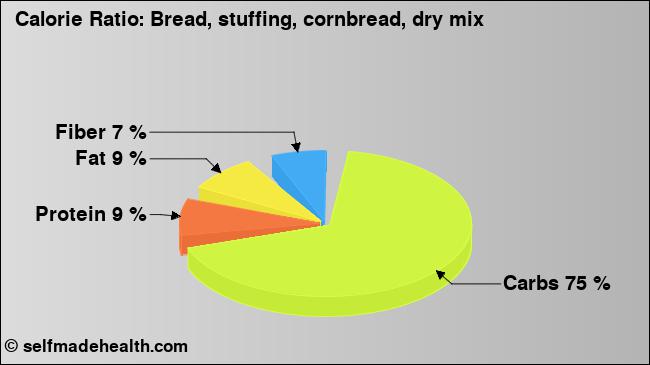
Carbohydrates
76.70
ggram
Sugarstotal
13.16
ggram
Dietary fibertotal dietary fiber
14.3
ggram
Protein
10.00
ggram
Vitamin Ctotal ascorbic acid
CalciumCa
MagnesiumMg
SodiumNa
Detailed Values
Energy
Amount per 100g (edible portion)
Daily Value %*
Energytotal energy
389
kcalkilocalorie
Energytotal energy
1628
kjkilojoule
Carbohydrates
Amount per 100g (edible portion)
Daily Value %*
Carbohydrates
76.70
ggram
Sugarstotal
13.16
ggram
Dietary fibertotal dietary fiber
14.3
ggram
Fat
Amount per 100g (edible portion)
Daily Value %*
Fat
4.20
ggram
Fatty acids, total saturated
0.922
ggram
12:0
0.002
ggram
14:0
0.017
ggram
16:0
0.624
ggram
18:0
0.276
ggram
Fatty acids, total monounsaturated
1.662
ggram
16:1 undifferentiated
0.066
ggram
18:1 undifferentiated
1.587
ggram
20:1
0.009
ggram
Fatty acids, total polyunsaturated
1.073
ggram
18:2 undifferentiated
1.025
ggram
18:3 undifferentiated
0.047
ggram
20:4 undifferentiated
0.001
ggram
Protein
Amount per 100g (edible portion)
Daily Value %*
Protein
10.00
ggram
Alanine
0.481
ggram
Arginine
0.441
ggram
Aspartic acid
0.546
ggram
Cystine
0.197
ggram
Glutamic acid
2.735
ggram
Glycine
0.381
ggram
Histidine
0.251
ggram
Isoleucine
0.364
ggram
Leucine
0.873
ggram
Lysine
0.278
ggram
Phenylalanine
0.498
ggram
Proline
1.017
ggram
Serine
0.486
ggram
Threonine
0.320
ggram
Tryptophan
0.105
ggram
Tyrosine
0.344
ggram
Valine
0.447
ggram
Methionine
0.186
ggram
Vitamins
Amount per 100g (edible portion)
Daily Value %*
Vitamins
Vitamin A
157
iuinternational units
Vitamin A
8
μgmicrogram
RetinolVitamin A1
0
μgmicrogram
Thiamin
RiboflavinVitamin B-2
NiacinVitamin B-3
4.873
mgmiligram
Pantothenic acidVitamin B-5
Vitamin B-6
FolateIncludes folate from food plus folic acid
175
μgmicrogram
FolateIncludes folate from food plus folic acid
Folate, food
42
μgmicrogram
Folic acid
133
μgmicrogram
Vitamin B-12Cobalamin
Vitamin Ctotal ascorbic acid
Minerals
Amount per 100g (edible portion)
Daily Value %*
MineralsCa
CalciumCa
MagnesiumMg
IronFe
SodiumNa
PhosphorusP
PotassiumK
ZincZn
SeleniumSe
CopperCu
ManganeseMn
Sterols
Amount per 100g (edible portion)
Daily Value %*
Sterols
Cholesterolcholesterol, total
0
mgmiligram
Other
Amount per 100g (edible portion)
Daily Value %*
Other
Water
4.60
ggram
Alcohol, ethyl
0.0
ggram
Ash in food
4.40
ggram
An empty value in the table means that no value is available and nothing is being said about it. 0 / 0.0 / 0.000 means that the nutrient is not contained at all or only in slight amounts.
The table above contains values from the following nutrition databases.
Notices
* Calculating the percentages of daily intake are for a 45 year old person and the average of man and woman. For the calculation the recommended dietary allowance (RDA) is used and, if not available, estimates of adequate intake (AI) or estimates of average requirement (EAR) are used.
** Calculated with the following factors: carbohydrates 4.1 kcal/g, proteins 3.8 kcal/g, fat 8.7 kcal/g, fibers 2 kcal/g, alcohol 7 kcal/g.
Sources
1
US Department of Agriculture. Agricultural Research Service. (2018). USDA National Nutrient Database for Standard Reference, Legacy (2018). Retrieved from https://ndb.nal.usda.gov/ndb/ at 2018-12-18.