Nutrition values of Cookies, brownies, dry mix, regular
according to USDA Food Composition Database Standard Reference 04.2018
Not the right food? Find other foods
The following nutrition values are sourced from: USDA Food Composition Database Standard Reference 04.20181.
Nutrition values
Amount per 100g (edible portion)
Nutrition Facts
Nutrition Facts
Amount per 100g (edible portion)
Daily Value %*
Nutrition Facts
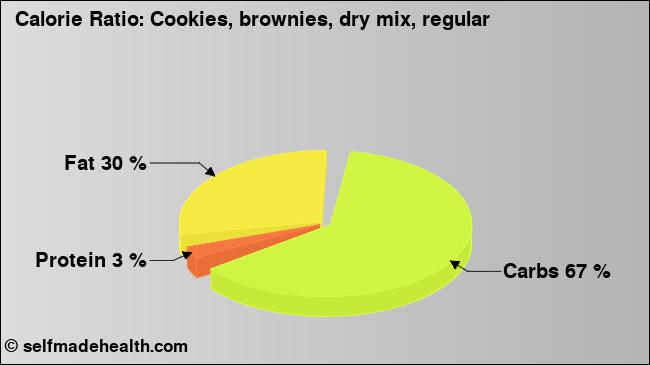
Fat
14.90
ggram
Fatty acids, total saturated
2.519
ggram
Fatty acids, total monounsaturated
5.158
ggram
Fatty acids, total polyunsaturated
6.373
ggram
Carbohydrates
76.60
ggram
Protein
4.00
ggram
Vitamin Ctotal ascorbic acid
CalciumCa
MagnesiumMg
SodiumNa
Detailed Values
Energy
Amount per 100g (edible portion)
Daily Value %*
Energytotal energy
434
kcalkilocalorie
Energytotal energy
1816
kjkilojoule
Fat
Amount per 100g (edible portion)
Daily Value %*
Fat
14.90
ggram
Fatty acids, total saturated
2.519
ggram
4:0
0.000
ggram
6:0
0.000
ggram
8:0
0.000
ggram
10:0
0.000
ggram
12:0
0.000
ggram
14:0
0.026
ggram
16:0
1.543
ggram
18:0
0.935
ggram
Fatty acids, total monounsaturated
5.158
ggram
16:1 undifferentiated
0.046
ggram
18:1 undifferentiated
5.045
ggram
20:1
0.042
ggram
22:1 undifferentiated
0.000
ggram
Fatty acids, total polyunsaturated
6.373
ggram
18:2 undifferentiated
5.549
ggram
18:3 undifferentiated
0.771
ggram
18:4
0.000
ggram
20:4 undifferentiated
0.002
ggram
20:5 n-3 (EPA)
0.000
ggram
22:5 n-3 (DPA)
0.000
ggram
Protein
Amount per 100g (edible portion)
Daily Value %*
Protein
4.00
ggram
Alanine
0.155
ggram
Arginine
0.228
ggram
Aspartic acid
0.297
ggram
Cystine
0.071
ggram
Glutamic acid
0.952
ggram
Glycine
0.163
ggram
Histidine
0.078
ggram
Isoleucine
0.154
ggram
Leucine
0.261
ggram
Lysine
0.165
ggram
Phenylalanine
0.191
ggram
Proline
0.296
ggram
Serine
0.195
ggram
Threonine
0.134
ggram
Tryptophan
0.058
ggram
Tyrosine
0.132
ggram
Valine
0.209
ggram
Methionine
0.057
ggram
Vitamins
Amount per 100g (edible portion)
Daily Value %*
Vitamins
Vitamin A
11
iuinternational units
Vitamin A
1
μgmicrogram
RetinolVitamin A1
0
μgmicrogram
Thiamin
RiboflavinVitamin B-2
NiacinVitamin B-3
1.882
mgmiligram
Pantothenic acidVitamin B-5
Vitamin B-6
FolateIncludes folate from food plus folic acid
35
μgmicrogram
FolateIncludes folate from food plus folic acid
Folate, food
9
μgmicrogram
Folic acid
26
μgmicrogram
Vitamin B-12Cobalamin
Vitamin Ctotal ascorbic acid
An empty value in the table means that no value is available and nothing is being said about it. 0 / 0.0 / 0.000 means that the nutrient is not contained at all or only in slight amounts.
The table above contains values from the following nutrition databases.
Notices
* Calculating the percentages of daily intake are for a 45 year old person and the average of man and woman. For the calculation the recommended dietary allowance (RDA) is used and, if not available, estimates of adequate intake (AI) or estimates of average requirement (EAR) are used.
** Calculated with the following factors: carbohydrates 3.8 kcal/g, proteins 3 kcal/g, fat 8.7 kcal/g, fibers 0 kcal/g, alcohol 7 kcal/g.
Sources
1
US Department of Agriculture. Agricultural Research Service. (2018). USDA National Nutrient Database for Standard Reference, Legacy (2018). Retrieved from https://ndb.nal.usda.gov/ndb/ at 2018-12-18.