Nutrition values of Cookies, chocolate chip, dry mix
according to USDA Food Composition Database Standard Reference 04.2018
Not the right food? Find other foods
The following nutrition values are sourced from: USDA Food Composition Database Standard Reference 04.20181.
Nutrition values
Amount per 100g (edible portion)
Nutrition Facts
Nutrition Facts
Amount per 100g (edible portion)
Daily Value %*
Nutrition Facts
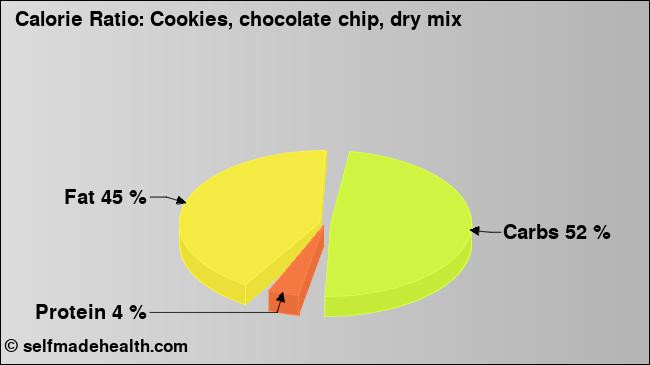
Fat
25.20
ggram
Fatty acids, total saturated
8.316
ggram
Fatty acids, total monounsaturated
13.077
ggram
Fatty acids, total polyunsaturated
2.620
ggram
Carbohydrates
66.10
ggram
Protein
4.60
ggram
Vitamin Ctotal ascorbic acid
CalciumCa
MagnesiumMg
SodiumNa
Detailed Values
Energy
Amount per 100g (edible portion)
Daily Value %*
Energytotal energy
497
kcalkilocalorie
Energytotal energy
2079
kjkilojoule
Fat
Amount per 100g (edible portion)
Daily Value %*
Fat
25.20
ggram
Fatty acids, total saturated
8.316
ggram
4:0
0.000
ggram
6:0
0.000
ggram
8:0
0.000
ggram
10:0
0.000
ggram
12:0
0.011
ggram
14:0
0.125
ggram
16:0
3.996
ggram
18:0
4.116
ggram
Fatty acids, total monounsaturated
13.077
ggram
16:1 undifferentiated
0.018
ggram
18:1 undifferentiated
13.061
ggram
20:1
0.000
ggram
22:1 undifferentiated
0.000
ggram
Fatty acids, total polyunsaturated
2.620
ggram
18:2 undifferentiated
2.486
ggram
18:3 undifferentiated
0.134
ggram
18:4
0.000
ggram
20:5 n-3 (EPA)
0.000
ggram
22:5 n-3 (DPA)
0.000
ggram
Protein
Amount per 100g (edible portion)
Daily Value %*
Protein
4.60
ggram
Alanine
0.143
ggram
Arginine
0.166
ggram
Aspartic acid
0.232
ggram
Cystine
0.084
ggram
Glutamic acid
1.397
ggram
Glycine
0.146
ggram
Histidine
0.089
ggram
Isoleucine
0.189
ggram
Leucine
0.337
ggram
Lysine
0.184
ggram
Phenylalanine
0.224
ggram
Proline
0.484
ggram
Serine
0.235
ggram
Threonine
0.141
ggram
Tryptophan
0.064
ggram
Tyrosine
0.148
ggram
Valine
0.222
ggram
Methionine
0.081
ggram
Vitamins
Amount per 100g (edible portion)
Daily Value %*
Vitamins
Vitamin A
4
iuinternational units
Vitamin A
0
μgmicrogram
RetinolVitamin A1
0
μgmicrogram
Thiamin
RiboflavinVitamin B-2
NiacinVitamin B-3
1.990
mgmiligram
Pantothenic acidVitamin B-5
Vitamin B-6
FolateIncludes folate from food plus folic acid
51
μgmicrogram
FolateIncludes folate from food plus folic acid
Folate, food
6
μgmicrogram
Folic acid
45
μgmicrogram
Vitamin B-12Cobalamin
Vitamin Ctotal ascorbic acid
Minerals
Amount per 100g (edible portion)
Daily Value %*
MineralsCa
CalciumCa
MagnesiumMg
IronFe
SodiumNa
PhosphorusP
PotassiumK
ZincZn
SeleniumSe
CopperCu
ManganeseMn
Sterols
Amount per 100g (edible portion)
Daily Value %*
Sterols
Cholesterolcholesterol, total
0
mgmiligram
Other
Amount per 100g (edible portion)
Daily Value %*
Other
Water
3.00
ggram
Ash in food
1.20
ggram
Caffeine
12
mgmiligram
Theobromine
91
mgmiligram
An empty value in the table means that no value is available and nothing is being said about it. 0 / 0.0 / 0.000 means that the nutrient is not contained at all or only in slight amounts.
The table above contains values from the following nutrition databases.
Notices
* Calculating the percentages of daily intake are for a 45 year old person and the average of man and woman. For the calculation the recommended dietary allowance (RDA) is used and, if not available, estimates of adequate intake (AI) or estimates of average requirement (EAR) are used.
** Calculated with the following factors: carbohydrates 3.9 kcal/g, proteins 4 kcal/g, fat 8.8 kcal/g, fibers 0 kcal/g, alcohol 7 kcal/g.
Sources
1
US Department of Agriculture. Agricultural Research Service. (2018). USDA National Nutrient Database for Standard Reference, Legacy (2018). Retrieved from https://ndb.nal.usda.gov/ndb/ at 2018-12-18.