Nutrition values of Snacks, rice cakes, brown rice, rye
according to USDA Food Composition Database Standard Reference 04.2018
Not the right food? Find other foods
The following nutrition values are sourced from: USDA Food Composition Database Standard Reference 04.20181.
Nutrition values
Amount per 100g (edible portion)
Nutrition Facts
Nutrition Facts
Amount per 100g (edible portion)
Daily Value %*
Nutrition Facts
Fat
3.80
ggram
Fatty acids, total saturated
0.580
ggram
Fatty acids, total monounsaturated
1.310
ggram
Fatty acids, total polyunsaturated
1.550
ggram
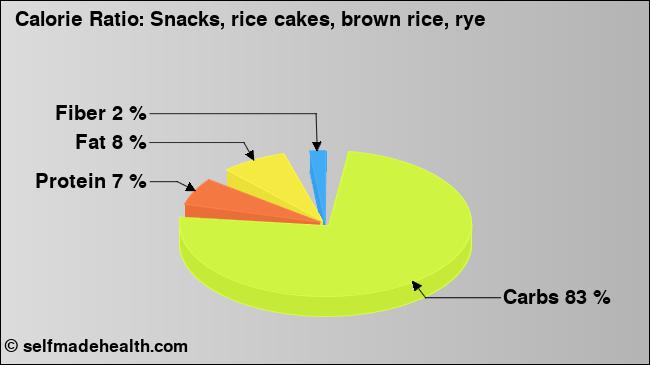
Carbohydrates
79.90
ggram
Dietary fibertotal dietary fiber
4.0
ggram
Protein
8.10
ggram
Vitamin Ctotal ascorbic acid
CalciumCa
MagnesiumMg
SodiumNa
Detailed Values
Energy
Amount per 100g (edible portion)
Daily Value %*
Energytotal energy
386
kcalkilocalorie
Energytotal energy
1615
kjkilojoule
Carbohydrates
Amount per 100g (edible portion)
Daily Value %*
Carbohydrates
79.90
ggram
Dietary fibertotal dietary fiber
4.0
ggram
Fat
Amount per 100g (edible portion)
Daily Value %*
Fat
3.80
ggram
Fatty acids, total saturated
0.580
ggram
12:0
0.000
ggram
14:0
0.010
ggram
16:0
0.450
ggram
18:0
0.110
ggram
Fatty acids, total monounsaturated
1.310
ggram
16:1 undifferentiated
0.010
ggram
18:1 undifferentiated
1.300
ggram
20:1
0.000
ggram
Fatty acids, total polyunsaturated
1.550
ggram
18:2 undifferentiated
1.490
ggram
18:3 undifferentiated
0.060
ggram
Protein
Amount per 100g (edible portion)
Daily Value %*
Protein
8.10
ggram
Alanine
0.443
ggram
Arginine
0.553
ggram
Aspartic acid
0.716
ggram
Cystine
0.127
ggram
Glutamic acid
1.769
ggram
Glycine
0.392
ggram
Histidine
0.204
ggram
Isoleucine
0.328
ggram
Leucine
0.621
ggram
Lysine
0.316
ggram
Phenylalanine
0.399
ggram
Proline
0.531
ggram
Serine
0.402
ggram
Threonine
0.294
ggram
Tryptophan
0.097
ggram
Tyrosine
0.261
ggram
Valine
0.451
ggram
Methionine
0.165
ggram
Vitamins
Amount per 100g (edible portion)
Daily Value %*
Vitamins
Vitamin A
3
iuinternational units
Vitamin A
0
μgmicrogram
RetinolVitamin A1
0
μgmicrogram
Thiamin
RiboflavinVitamin B-2
NiacinVitamin B-3
7.040
mgmiligram
Pantothenic acidVitamin B-5
Vitamin B-6
FolateIncludes folate from food plus folic acid
5
μgmicrogram
FolateIncludes folate from food plus folic acid
Folate, food
5
μgmicrogram
Folic acid
0
μgmicrogram
Vitamin B-12Cobalamin
Vitamin Ctotal ascorbic acid
An empty value in the table means that no value is available and nothing is being said about it. 0 / 0.0 / 0.000 means that the nutrient is not contained at all or only in slight amounts.
The table above contains values from the following nutrition databases.
Notices
* Calculating the percentages of daily intake are for a 45 year old person and the average of man and woman. For the calculation the recommended dietary allowance (RDA) is used and, if not available, estimates of adequate intake (AI) or estimates of average requirement (EAR) are used.
** Calculated with the following factors: carbohydrates 4.1 kcal/g, proteins 3.3 kcal/g, fat 8.4 kcal/g, fibers 2 kcal/g, alcohol 7 kcal/g.
Sources
1
US Department of Agriculture. Agricultural Research Service. (2018). USDA National Nutrient Database for Standard Reference, Legacy (2018). Retrieved from https://ndb.nal.usda.gov/ndb/ at 2018-12-18.